
An Interview with Anna Rosling-Rönnlund,
Gapminder Co-Founder and Vice President
For this month’s commentary, GROWTH interviewed Anna Rosling-Rönnlund, Vice President and Head of Creativity at Gapminder, the organization that has developed amazing video representations of global socioeconomic and health data in fascinating displays. The Gapminder team considers their organization to be a “fact tank” not a “think tank,” as they produce resources based on reliable data to make the world more understandable and to correct misconceptions about global development. This independent Swedish foundation has no political, religious, or economic affiliations and collaborates with universities, the United Nations, public agencies, and non-governmental organizations.
The popular TEDtalks and videos are only possible because Gapminder has taken advantage of the fact that today, for the first time in human history, there are reliable statistics about almost every aspect of global development. The data reveal some surprising but always interesting facts about the people and countries and Gapminder allows users of these statistics to make comparisons in beautifully articulate visualizations.
The reality is a world in which most socioeconomic and health conditions improve over time. All cultures and religions are composed of people who make decisions based on the same universal human needs. As the total number of children in the world levels off, the rapid global population growth will inevitably stop or slow down considerably. Any remaining growth is a consequence of large generation booms from decades ago. “We live in a globalized world, not only in terms of trade and migration. More people than ever care about global development!”
The GROWTH Team conducted a long-range interview with Anna Rosling-Rönnlund this past summer. We share the content with you here, but we encourage you to view the interactive tools created by Gapminder and used throughout the world to educate the next generation to understand the real facts and not rely on the dramatic news stories for their worldviews.
GROWTH: Anna, Gapminder was started by you, your husband, and your late father-in-law as a way of helping people understand global health and economics better and to help them teach others. Is that correct? Can you please tell us more about the origins of Gapminder? What inspired you three to develop Gapminder?
Anna Rosling-Rönnlund (ARR): Early on Ola and I were just helping my father-in-law, Hans, with some tasks that frustrated him. We started developing the animating charts because it was fun and we thought it would be useful for Hans. But we had no idea at that point it would take us to the UN, Davos, Google, and other prominent places all over the World and that the ideas and tools we developed together would make Hans a superstar.
People get their worldview mostly through media (which leads to an overly dramatic worldview as the media only portrays extraordinary events) and advocacy (which wants to scare people to act in certain ways). Instead Gapminder encourages a balanced, fact-based worldview that everyone can understand. And it is free to use.
GROWTH: The Gapminder videos and the TED talks transform static data into visually appealing presentations. How did you and the Gapminder team come up with these ideas and approaches to visualizing data and trends?
ARR: We have been looking at the data very carefully and searched for the best way to communicate it so people can really understand. It has to be easily understood by non-experts and that can sometimes be a hard nut to crack. We try to explain slow trends and global proportions as they are often missed.
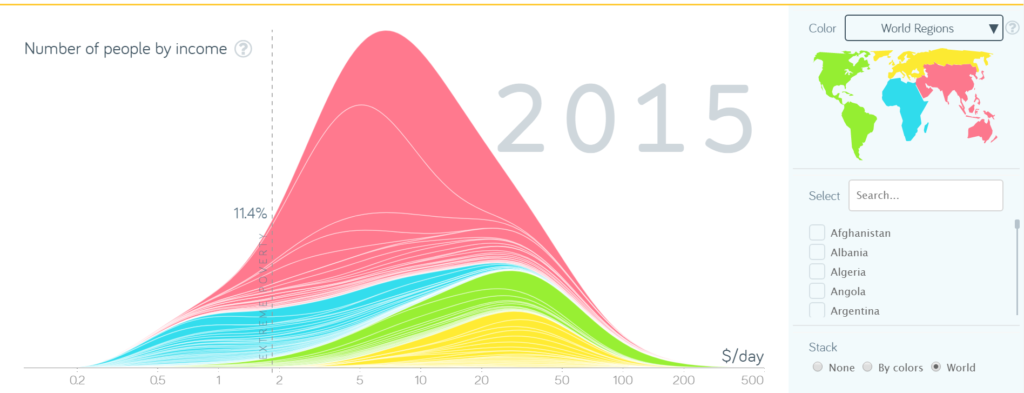
We focus on three mega misconceptions:
- "The world is divided in two"
- "Everything is getting worse"
- "The population just keeps growing"
GROWTH: How did the early work morph into the way Gapminder works today? How have the main objectives changed (or not) since you started Gapminder? Please expand on your products, outputs, and visualization techniques.
ARR: Early on we had no idea we were innovators in this field. But gradually we have realized we have a unique voice and idea. We work to spread a fact-based worldview everyone can understand. We have worked closely with Hans for 18 years and will continue with the work we started together.
GROWTH: How can our GROWTH audience access Gapminder's visual knowledge? Explain how people can use the tools and resources of Gapminder to make these creative presentations? Are there costs to the users?
ARR: Everything we do is free for anyone to use. Go to gapminder.org to explore. We have slide decks, videos, and tools for anyone to use!
GROWTH: Looking ahead, what changes, enhancements, and new products do you have planned for Gapminder over the next 5 years?
ARR: These are our main goals for the near future:
- Publish our book Factfulness early in 2018.
- Develop our knowledge testing further and start certifying the knowledge of educational institutions, organizations, and companies.
- Spread the use of our tools and resources more widely and ensure they will be used in schools all over the world. We will have a network of Gapminders all over the world who will help us spread the information.
Thank you, Anna! Gapminder offers fascinating information and visuals that will be helpful for the research and teaching activities of our GROWTH audience. We greatly appreciate your contributions to this GROWTH Commentaries Series on Global Health!
Free videos from www.gapminder.org
About the author:
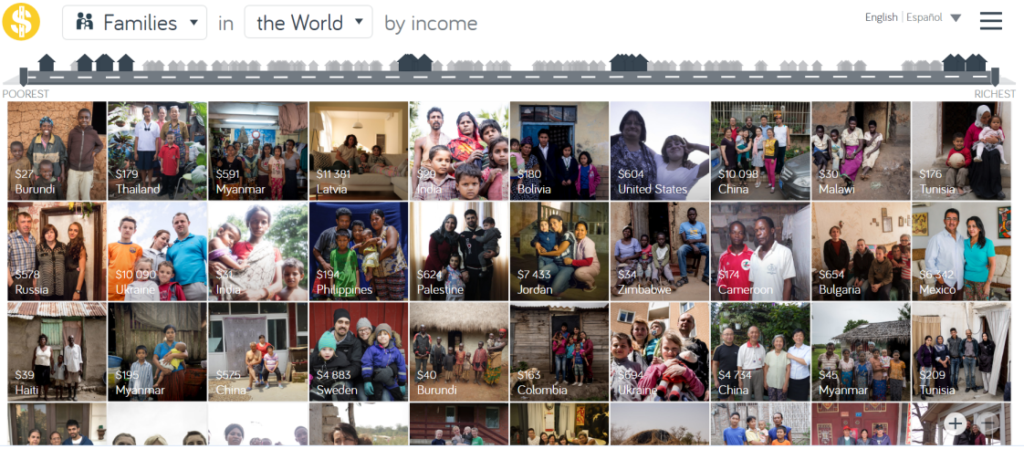
Anna Rosling Rönnlund is a co-founder and board member of the Gapminder Foundation. She holds a degree in sociology and photography. Anna designed the user-interface of the famous animating bubble-chart tool called Trendalyzer, used by millions of students across the world, to understand multidimensional time series. The tool was acquired by Google where Anna worked as Senior Usability Designer designing interactive search results for statistical queries as well as the Motion Chart in Google Spreadsheets. Anna went back to Gapminder in 2011 to develop new free teaching material. As Product Manager, Art Director & Usability Lead of the Gapminder Foundation she is running the Dollar Street project which makes everyone’s living condition understandable to everyone, by using photos as big data.